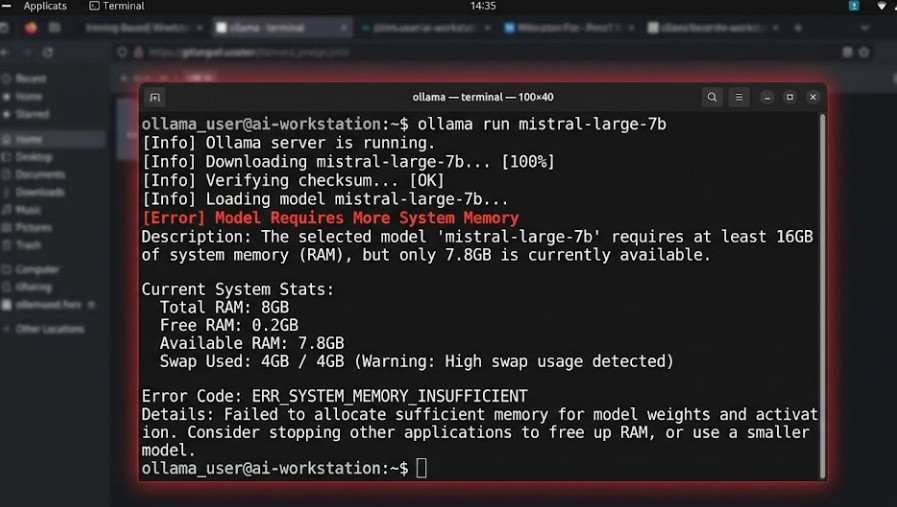
If Ollama just told you it requires more system memory than what’s available and flat-out refused to load your model, you’re not imagining a bug — it’s doing exactly what it’s built to do when there isn’t enough RAM to safely hold the model. I hit this on a machine that, on paper, had plenty of headroom, and the actual fix had less to do with hardware and more to do with what else was quietly eating my RAM. Here’s what causes it and what actually fixed it, both for me and for a bunch of people in the Ollama GitHub issues.
Quick Answer
If you just want the short version before reading the rest:
- Close memory-heavy apps (browser tabs, Docker, IDEs) before running
ollama run - Switch to a smaller quantization — Q4_K_M instead of Q8_0 or fp16
- Lower
num_ctx(context length); large context windows multiply memory use fast - On Windows, check your WSL2 memory cap in
.wslconfig— it defaults to half your RAM - Restart the Ollama service; an old model sometimes stays loaded and holds memory hostage
If none of those do it, keep reading — there are a couple of weirder causes further down that don’t get mentioned much.
Why This Error Happens
The obvious cause is the literal one: the model you’re trying to load is bigger than the RAM you have free. But “free” is doing a lot of work in that sentence, and that’s where most of the confusion starts.
Quantization level mismatch. A model tagged the same name can ship in wildly different sizes depending on quantization. Pulling the fp16 or Q8 version of a 13B model can need close to double the memory of the Q4_K_M version. I’ve seen people grab the wrong tag from the Ollama library, not notice, and assume their hardware just isn’t good enough.
Context length (num_ctx) blowing up the KV cache. This one surprises people. Increasing the context window doesn’t just let the model “remember more” — it scales the memory needed for the key-value cache, and on longer contexts that overhead can be larger than the model weights themselves. So a model that loads fine at 2048 context can fail outright at 8192 or 16384.
Something else is already holding the RAM. Browsers are the usual suspect, but Docker Desktop, Electron apps, and even leftover Ollama processes from a crashed session can sit there holding memory Ollama assumes is free. From what I’ve seen, this is the single most common cause that gets misdiagnosed as a hardware limitation.
WSL2’s memory cap on Windows. This one’s not well known. WSL2 defaults to using 50% of your host RAM, no matter how much physical memory your machine actually has. So on a 32GB Windows box, Ollama running inside WSL2 might only ever see ~16GB — and the error message gives zero indication that the cap is artificial.
Multiple models loaded at once. Ollama keeps models resident in memory for a while after use (keep_alive), and if you’re switching between models in quick succession, or running more than one at a time, the older one might not have been unloaded yet. It’s still sitting there, taking up space, when the new load request comes in.
And there’s one more cause that’s genuinely easy to miss: memory fragmentation. The system can report a chunk of “available” memory that isn’t actually contiguous enough to satisfy one large allocation. It’s rare, but it happens, usually after a machine’s been running a long time without a reboot.
Common Scenarios
This error shows up a little differently depending on the setup:
- Laptops with 16GB RAM trying to run 13B+ models at higher quantization — the classic case, and honestly the most straightforward to fix.
- Windows + WSL2 users who assume their full RAM is available to Ollama when it isn’t.
- Docker deployments where the container has a memory limit set lower than the host machine actually has.
- Shared servers or homelab boxes running Ollama alongside other services (Plex, a database, a CI runner) that quietly use more RAM than expected.
- Apple Silicon Macs, where memory is unified between CPU and GPU, so a handful of memory-hungry browser tabs can eat into what would otherwise go to the model.
Environment Comparison
| Environment | Likely Cause | First Thing to Check | Typical Fix |
|---|---|---|---|
| Windows + WSL2 | Memory cap (50% of host RAM by default) | .wslconfig memory line | Raise the memory= value, or run Ollama natively |
| macOS (Apple Silicon) | Shared unified memory used by other apps | Activity Monitor → Memory tab | Close apps, drop to a smaller quant |
| Linux (no GPU) | Model too large for available RAM at current quant | free -h before running | Smaller quant, or add swap |
| Docker container | Container memory limit set below host capacity | docker stats | Raise --memory on the container |
Step-by-Step Fixes
Step 1: Check what’s actually using your memory right now
Before changing anything, look at the real numbers. On Linux, run free -h. On Mac, open Activity Monitor and sort by memory. On Windows, Task Manager’s Performance tab works, but if you’re in WSL2, also run free -h inside the WSL terminal — the numbers can be very different from what Windows reports.
Step 2: Switch to a smaller quantization
This is the fix that solves the problem most often, in my experience. Pull the Q4_K_M version instead of Q8_0 or the full-precision release:
ollama pull llama3:8b-instruct-q4_K_MIt’s a noticeably smaller download and a smaller memory footprint, with a relatively small quality trade-off for most use cases.
Step 3: Lower the context length
If you’re setting a large context window in your Modelfile or API call, bring it down and test again:
PARAMETER num_ctx 2048Bump it back up gradually once things are stable, rather than maxing it out from the start.
Step 4: Fix the WSL2 memory cap (Windows users)
Edit (or create) .wslconfig in your Windows user folder:
[wsl2]
memory=24GB
Then run wsl --shutdown and restart WSL. This step alone solves the error for a surprising number of Windows users who have plenty of physical RAM but never knew about the default cap.
Step 5: Restart Ollama and clear loaded models
ollama ps
ollama stop <model-name>
If models are still listed as running, stop them, or just restart the Ollama service entirely (sudo systemctl restart ollama on Linux, or quit and reopen the app on Mac/Windows).
Step 6: Add swap space (last resort)
This won’t make things fast, but it can get a model to load when nothing else has worked:
sudo fallocate -l 8G /swapfile
sudo chmod 600 /swapfile
sudo mkswap /swapfile
sudo swapon /swapfile
Your mileage may vary here — swap helps with loading, not with usable inference speed, since disk is much slower than RAM.
What Actually Worked For Me
So here’s the part where I admit I went down a slightly wrong path first. My instinct was that the model was just too big for the machine, full stop, so I spent close to an hour trying smaller and smaller quantizations. That helped a little, but the error kept coming back intermittently, which didn’t match a simple “not enough RAM” story.
Turned out the real issue — and I only found this from an old forum comment I half-remembered seeing weeks earlier — was that I had Docker Desktop running in the background with its own memory reservation set way higher than I needed, left over from a project I wasn’t even working on anymore. Closing Docker freed up close to 6GB instantly, and the model that had been failing to load suddenly loaded fine, at the same quantization I’d already tried.
Not 100% sure why Docker’s memory reservation doesn’t get reported more clearly in the error message Ollama gives you, but that’s a separate complaint. The lesson, for me, was to stop assuming the model is the problem before checking what else is sitting on the machine.
Advanced Fixes and Edge Cases
If the basic fixes don’t move the needle, there are a couple of deeper things worth checking.
Check the OOM killer logs (Linux). If the process is getting killed rather than gracefully refusing to load, run dmesg | grep -i oom after a failed attempt. If the kernel’s out-of-memory killer fired, that confirms it’s a genuine memory shortage rather than a misreported one, and tells you roughly how much was actually needed at the moment of the crash.
Tune GPU offload with num_gpu. If you’ve got a GPU but limited VRAM, Ollama splits layers between GPU and system RAM. Setting num_gpu explicitly (lower than the default) can shift more of the load to the GPU and reduce system RAM pressure, or vice versa, depending on which resource is actually constrained.
Limit concurrently loaded models. The environment variables OLLAMA_MAX_LOADED_MODELS and OLLAMA_NUM_PARALLEL control how many models and parallel requests Ollama keeps in memory at once. Setting both to 1 forces Ollama to fully unload a model before loading the next one, which trades a bit of switching speed for a lot of memory headroom.
Check ~/.ollama/logs (or journalctl -u ollama on systemd setups). The CLI error is short on detail, but the logs sometimes show the exact memory figures Ollama calculated before refusing to load — useful if you’re trying to figure out exactly how much more RAM you’d need.
Prevention Tips
- Pick quantization based on your actual available RAM, not the model’s “recommended” size on a different machine
- Set
num_ctxto what you need, not the maximum the model supports - On Windows, set a sane WSL2 memory limit once, rather than discovering the default the hard way
- Restart Ollama occasionally if you switch between models a lot — don’t let old sessions pile up
- Keep an eye on what else is running before a big model load, especially Docker and browser-based AI tools that quietly reserve memory
Frequently Asked Questions
Does adding more RAM always fix this error? Usually, yes, if the cause is genuinely insufficient memory. But if it’s a WSL2 cap or Docker memory limit, more physical RAM won’t help until the cap itself is raised.
Is reinstalling Ollama a real fix? Rarely. It’s one of those steps that gets recommended a lot in forums but mostly just resets configuration files — it won’t free up RAM that other processes are using.
Why does the same model work on one machine but not another with similar specs? Usually quantization tag differences, different context length settings, or background processes eating memory differently on each machine.
Can I run a 70B model on 16GB of RAM at all? Not realistically at usable quality. Even aggressive quantization on a 70B model needs significantly more than 16GB. Stick to 7B–13B range models on that kind of hardware.
Does closing Ollama fully unload the model from memory? It should, but in practice a stuck process or a crashed session can leave memory allocated. Checking ollama ps and restarting the service if needed clears that up.
Editor’s Opinion
honestly this error message could just say “close your other apps” half the time and save everyone an hour of googling. the WSL2 default memory cap thing is the one that annoys me most — nobody expects an OS-level virtualization setting to be the reason their AI model won’t load. quant size matters too but in my experience the background-process thing trips up more people than actual hardware limits do. check what’s running first, then worry about the model.
1 thought on “How to Fix the “Model Requires More System Memory” Error in Ollama”